Dynatrace Kubernetes Monitoring
- 1Runs onAndroid, API, iOS, Linux, self-hosted, Web
- 2Costsfree trial · paid from $1.40/mo
Overview
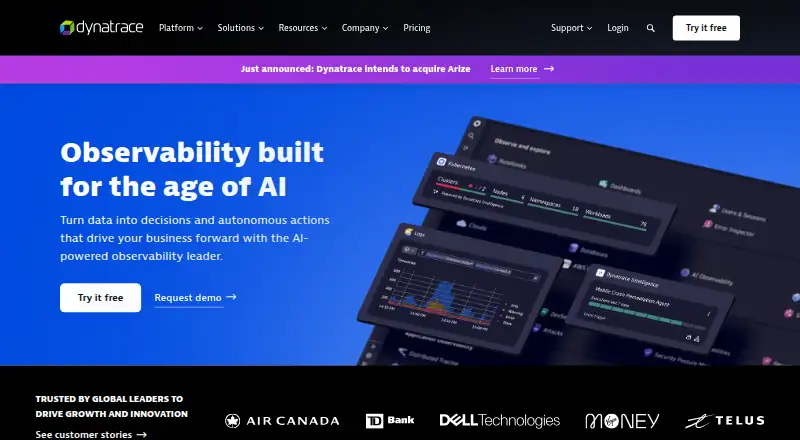
Dynatrace Kubernetes Monitoring tracks the health, performance, and security of containerized applications and multi-cloud infrastructure using metrics, traces, and logs. It discovers Kubernetes nodes and pods and brings their metrics, events, and logs into one view. Kubernetes alerting is included, and Monitoring as Code supports GitOps practices. Exploratory and predictive analyses help identify cluster utilization and workloads that consume too many or too few resources. Application insights include distributed tracing, code-level profiling, deployment validation, and automatic identification of root causes and impact. Listed environments include Amazon EKS, Azure AKS, Kubernetes, Google GKE, Red Hat OpenShift, and Rancher Kubernetes Engine. Setup installs Dynatrace Operator with Helm or a manifest and requires access from Dynatrace pods to the environment URL. Monitoring is licensed by pod-hours and requires a Dynatrace Platform Subscription. The 15-day trial applies to the platform; there is no free plan. The new Kubernetes experience requires a SaaS environment powered by Grail and AppEngine, and is unavailable for Managed or non-Grail SaaS environments.
Who it is for
It suits platform engineers, site reliability engineers, and Kubernetes administrators who need cluster telemetry, alerting, and workload analysis. Teams should check the Grail and AppEngine requirement for the new experience.
What is good
- Combines Kubernetes metrics, events, and logs.
- Includes alerting and Monitoring as Code.
- Analyzes cluster utilization and workload resource use.
- Supports multiple Kubernetes distributions.
What to know first
- No free plan is listed.
- Requires a Dynatrace Platform Subscription.
- New experience excludes Managed and non-Grail SaaS environments.
Specifiction review
Dynatrace Kubernetes Monitoring: the full review
Dynatrace combines cluster-level visibility with application tracing and workload analysis. Its pod-hour licensing, platform subscription requirement, and SaaS eligibility limit are central considerations.
Dynatrace Kubernetes Monitoring brings cluster telemetry and application diagnostics into Dynatrace’s platform. It is best suited to platform engineers, SREs and Kubernetes administrators managing supported clusters who need to connect workload behavior with application issues. The combined view is its strongest reason to choose it; pod-hour billing and strict SaaS eligibility may rule it out for otherwise suitable teams.
Overview
Continuous discovery brings Kubernetes nodes and pods, their metrics, events and logs into one view. Distributed tracing, code-level profiling and automatic root-cause and impact identification extend that view into applications, while deployment validation can help teams assess changes. This breadth is valuable when infrastructure and application teams need shared troubleshooting context, but unnecessary overhead for teams seeking only basic cluster monitoring.
Supported distributions include Amazon EKS, Azure AKS, Google GKE, Red Hat OpenShift, Rancher Kubernetes Engine and Kubernetes. The Kubernetes page names EKS, AKS, GKE, OpenShift, Prometheus and Fluentd integrations; the broader platform has 900+ integrations. Installation uses Dynatrace Operator through Helm or a manifest, and Dynatrace pods need access to the Dynatrace environment URL.
Key features
- Cluster visibility and alerts: Metrics, events and logs are consolidated, with out-of-the-box Kubernetes alerting. That gives operators a useful starting point without having to assemble basic alert coverage themselves.
- GitOps and workload analysis: Monitoring as Code supports GitOps practices. Exploratory and predictive analyses help identify utilization patterns and workloads using too many or too few resources, useful for teams tuning cluster allocations.
- Application diagnosis: Tracing, profiling, root-cause and impact identification, and deployment validation help connect cluster symptoms to application behavior and changes. Teams that need only infrastructure metrics may not benefit enough from this additional scope.
Pricing
Dynatrace requires a Dynatrace Platform Subscription and licenses Kubernetes platform monitoring by pod-hours. The listed hourly rate is $0.002 per hour per pod. The Kubernetes Platform Monitoring plan is $1.40 /mo per pod, billed at $0.002 per hour per pod; it includes Kubernetes metrics and events, and is included on hosts with Full-Stack Monitoring at no additional charge. The separate hourly-rate plan is $0.00 per month, billed at the same hourly pod rate. The hourly model ties cost to pod use, so teams should account for workload scale and the platform subscription requirement rather than treating the monthly figure as a flat cluster price.
A 15-day free trial covers the platform; there is no free plan. The new Kubernetes experience requires a Dynatrace SaaS environment powered by Grail and AppEngine. It is unavailable for Managed or non-Grail SaaS environments, a significant limitation for organizations committed to those deployments.
Platforms
The product platform lists Android, iOS, Linux, web, API and self-hosted support, and the deployment model is hybrid. Kubernetes coverage includes EKS, AKS, GKE, OpenShift, Rancher Kubernetes Engine and Kubernetes. Data retention is 35 days, and the check interval is one minute. Supported telemetry includes metrics, logs, traces and events; alert channels include Opsgenie, VictorOps, PagerDuty, xMatters, Jira, Trello, Slack, ServiceNow, email and webhook.
Who it's for
Platform engineers, site reliability engineers and Kubernetes administrators are the clearest fit, particularly when they need workload analysis and application-level diagnosis alongside cluster health. Organizations requiring the new experience must also be able to use the eligible SaaS environment. Teams needing only a small, standalone Kubernetes monitor, or unable to use that SaaS configuration, should look elsewhere.
Pros and cons
- Pro: Cluster metrics, events and logs sit alongside tracing and code profiling, helping teams investigate across infrastructure and applications.
- Pro: Predictive and exploratory workload analysis can surface both overuse and underuse of resources.
- Pro: Monitoring as Code and built-in alerting suit teams managing Kubernetes through GitOps practices.
- Con: Pod-hour licensing plus the required platform subscription makes cost dependent on usage and the wider Dynatrace commitment.
- Con: The new experience excludes Managed and non-Grail SaaS environments.
- Con: A 15-day trial but no free plan leaves no ongoing free tier for small or exploratory deployments.
Alternatives
New Relic Kubernetes Monitoring is worth considering for teams seeking a free entry point: its free plan is available, while Pro costs $349.00 USD per year with annual commitments and includes unlimited full platform users and 100 GB free data ingest, with $0.40/GB beyond that limit. Grafana Cloud Application Observability offers an always-free plan with 2,232 host hours; its Pro plan is $0.025 per host hour with a $19 monthly platform fee, making it an alternative for teams comparing a host-hour model with Dynatrace’s pod-hour licensing. Elastic Observability has a free plan and a usage-based serverless option whose logs and traces ingest starts at $0.09/; it may suit teams comparing usage-based observability options. Site24x7 Synthetic Monitoring has a free plan and synthetic transactions for $8 per month for 10,000 transactions, so it is a more focused option when synthetic checks are the priority. Dotcom-Monitor offers a free plan for up to 25 targets, checks as often as every five minutes, two monitoring locations and email alerts. Checkly has a free Hobby plan with uptime monitors and browser and API check-run quotas. HostTracker has a free plan with two monitors and checks every 30 minutes. Uptrends is a paid alternative with a Core plan at $42.00 USD per month, annual billing and uptime checks every two minutes. For category browsing, see Observability Platforms, IT Operations Management Software, Application Dependency Mapping Software, Synthetic Monitoring, DNS Monitoring Software and Real User Monitoring.
Verdict
Choose Dynatrace Kubernetes Monitoring if your platform or SRE team needs cluster telemetry tied directly to application diagnosis and workload analysis, and can meet its SaaS eligibility requirements. Look elsewhere if you need a free ongoing tier, a cluster-only tool, or a deployment outside the new experience’s SaaS limits; pod-hour licensing and the required platform subscription make those constraints central to the decision.
Dynatrace Kubernetes Monitoring plans and pricing
All plansCompared on Kubernetes monitoring
- Free plan
- Nodynatrace.com
Facts
- Purpose
- Monitors the health, performance, and security of containerized applications and multi-cloud infrastructure using metrics, traces, and logs.dynatrace.com · 29 Sept 2026
- Cluster visibility
- Continuously discovers Kubernetes nodes and pods and presents their metrics, events, and logs in one view.dynatrace.com · 29 Sept 2026
- Alerting and GitOps
- The product provides out-of-the-box Kubernetes alerting and supports GitOps practices with Monitoring as Code.dynatrace.com · 29 Sept 2026
- Resource optimization
- Exploratory and predictive analyses help identify cluster utilization and workloads that consume too many or too few resources.dynatrace.com · 29 Sept 2026
- Application insights
- Dynatrace describes automatic root-cause and impact identification, distributed tracing, code-level profiling, and deployment validation for Kubernetes environments.dynatrace.com · 29 Sept 2026
- Supported distributions
- The page lists Amazon EKS, Azure AKS, Kubernetes, Google GKE, Red Hat OpenShift, and Rancher Kubernetes Engine.dynatrace.com · 29 Sept 2026
- Integrations
- The Kubernetes page lists EKS, AKS, GKE, OpenShift, Prometheus, and Fluentd among its integrations and says the platform has 900+ integrations.dynatrace.com · 29 Sept 2026
- Deployment
- The setup guide installs Dynatrace Operator with Helm or a manifest and requires access from Dynatrace pods to the Dynatrace environment URL.docs.dynatrace.com · 29 Sept 2026
- Licensing requirements
- Kubernetes platform monitoring requires Dynatrace Platform Subscription and is licensed by pod-hours.docs.dynatrace.com · 29 Sept 2026
- Eligibility limit
- The new Kubernetes experience requires a Dynatrace SaaS environment powered by Grail and AppEngine; it is unavailable for Managed or non-Grail SaaS environments.docs.dynatrace.com · 29 Sept 2026
- Trial
- Dynatrace advertises a 15-day free trial of its platform.dynatrace.com · 29 Sept 2026
- Security and compliance
- Dynatrace's Trust Center lists certifications and frameworks including FedRAMP Moderate, HIPAA, ISO 27001:2022, SOC 2 Type II, and GDPR.dynatrace.com · 29 Sept 2026
- Data protection
- Dynatrace describes encryption in transit and at rest, data separation, configurable retention, masking, and hard deletion controls.dynatrace.com · 29 Sept 2026
- Support
- Standard Support is listed as business-hours access Monday through Friday, while Enterprise Success & Support offers 24/7/365 access.dynatrace.com · 29 Sept 2026
- Intended users
- Dynatrace says its Kubernetes setup tutorial is intended for platform engineers, site reliability engineers, and Kubernetes administrators.docs.dynatrace.com · 29 Sept 2026
Company
- Founded
- 2005dynatrace.com · 28 Sept 2026
- Headquarters
- Boston, Massachusetts, United Statesdynatrace.com · 28 Sept 2026
Best Dynatrace Kubernetes Monitoring alternatives
See all 20

Where it ranks on Specifiction
- Best Kubernetes Monitoring in 2026#4 of 50
- Best Container Monitoring in 2026#5 of 46
- Best Synthetic Monitoring in 2026#1 of 42
- Best Application Dependency Mapping Software in 2026#3 of 38
- Best DNS Monitoring Software in 2026#2 of 37
- Best Database Monitoring in 2026#3 of 35
- Best Metrics Monitoring Tools in 2026#3 of 34
- Best Real User Monitoring in 2026#3 of 28
- Best Observability Platforms in 2026#2 of 27
- Best IT Operations Management Software in 2026#2 of 23
Is Dynatrace Kubernetes Monitoring yours?
Claim it for free: prove the domain, then correct facts, plans and screenshots. An editor reviews every change.
Sources
- dynatrace.com/technologies/kubernetes-monitoring/· checked 29 Sept 2026
- docs.dynatrace.com/docs/ingest-from/setup-on-k8s/deploymen· checked 29 Sept 2026
- docs.dynatrace.com/docs/observe/infrastructure-monitoring/· checked 29 Sept 2026
- dynatrace.com/pricing/· checked 29 Sept 2026
- dynatrace.com/company/trust-center/· checked 29 Sept 2026
- dynatrace.com/company/trust-center/data-protection/· checked 29 Sept 2026
- dynatrace.com/services-support/dynatrace-one/· checked 29 Sept 2026
- dynatrace.com/platform/kubernetes-monitoring/· checked 28 Sept 2026
- dynatrace.com/platform/database-monitoring/· checked 28 Sept 2026
- dynatrace.com/pricing/rate-card/· checked 21 Sept 2026