Tech riderRev. 3 Oct 2026
Grafana Cloud Kubernetes Monitoring
- 1Runs onLinux, self-hosted, Web
- 2CostsFree plan
- 3Supported platformsKubernetes, Amazon EKS, Google GKE, Azure AKS, GKE Autopilot, IBM Cloud Kubernetes Service, Red Hat OpenShift, and EKS on AWS Fargate
- 4Container metricsYes
- 5Resource alertsYes
- 6Image monitoringYes
- 7Runtime eventsYes
- 8Container log collectionYes
8 lines stated Written from the maker's own pages: grafana.com
Overview
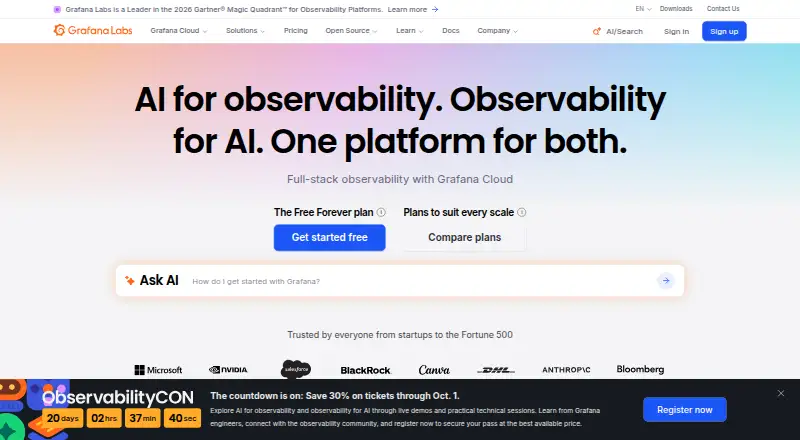
Grafana Cloud Kubernetes Monitoring is ranked #29 of 46 in container monitoring on Specifiction. It runs on Linux, Self-hosted, Web. There is a free plan.
Grafana Cloud Kubernetes Monitoring plans and pricing
All plansPro 2,232 host hours included per month · 37,944 container hours included per month grafana.com · 21 Sept 2026
Free Free Always free 2,232 host hours & 37,944 container hours per month · Community support · No credit card required grafana.com · 3 Oct 2026
Enterprise Scalable unit price based on annual commit Minimum commit of $25,000 per year · Premium support · Deployment flexibility grafana.com · 3 Oct 2026
Pro Platform fee of $19 per month includes the listed usage; then pay as you go 2,232 host hours & 37,944 container hours per month included · 8×5 email support · Automatic volume discounts grafana.com · 3 Oct 2026
Compared on container monitoring
- Free plan
- Yesgrafana.com
- Supported platforms
- Kubernetes, Amazon EKS, Google GKE, Azure AKS, GKE Autopilot, IBM Cloud Kubernetes Service, Red Hat OpenShift, and EKS on AWS Fargategrafana.com
- Container metrics
- Yesgrafana.com
- Resource alerts
- Yesgrafana.com
- Image monitoring
- Yesgrafana.com
- Runtime events
- Yesgrafana.com
- Container log collection
- Yesgrafana.com
Facts
- Purpose
- Grafana Cloud Kubernetes Monitoring provides dashboards and alerts for monitoring and troubleshooting Kubernetes fleets, including resource usage, health, performance, and costs.grafana.com · 3 Oct 2026
- Unified view
- The application lets users inspect Kubernetes objects and troubleshoot infrastructure from one interface.grafana.com · 3 Oct 2026
- Built-in features
- The product includes cost and resource-efficiency tools, job and energy monitoring, alerts, recording rules, and predictions.grafana.com · 3 Oct 2026
- Telemetry collection
- Grafana Alloy collects Kubernetes metrics, events, and Pod logs, receives application traces, and sends data to Grafana Cloud.grafana.com · 3 Oct 2026
- Cost monitoring
- Cost views use OpenCost to estimate Kubernetes infrastructure costs and show allocations across clusters, namespaces, workloads, Pods, and containers.grafana.com · 3 Oct 2026
- Application integrations
- Application telemetry can be sent through OpenTelemetry, Zipkin, or Jaeger receivers, or gathered through compatible Prometheus integrations.grafana.com · 3 Oct 2026
- Supported Kubernetes platforms
- The Helm chart supports Kubernetes including EKS on EC2 and GKE, EKS on Fargate, AKS, GKE Autopilot, IBM Cloud Kubernetes Service, and Red Hat OpenShift.grafana.com · 3 Oct 2026
- Cloud-only availability
- Kubernetes Monitoring is available only in Grafana Cloud and supports only data sources hosted in Grafana Cloud.grafana.com · 3 Oct 2026
- Billing meters
- For plans using the current model, billing is based on active Kubernetes host hours and active container hours reported by kube-state-metrics.grafana.com · 3 Oct 2026
- Separate telemetry charges
- Telemetry from other products on the same cluster, including NGINX integration and Application Observability, is billed separately from Kubernetes Monitoring.grafana.com · 3 Oct 2026
- Security certifications
- Grafana Labs lists ISO 27001 and SOC 2 Type 2 certifications, PCI compliance, a GDPR data processor agreement, and participation in the Cloud Security Alliance STAR program.grafana.com · 3 Oct 2026
- Setup requirements
- The Helm setup requires a Grafana Cloud account, a Kubernetes cluster, kubectl and Helm, and the Admin role to install alerts.grafana.com · 3 Oct 2026
- Company
- Grafana Labs is headquartered in New York, New York, USA, and was founded in 2014.grafana.com · 3 Oct 2026
Company
- Founded
- 2014grafana.com · 28 Sept 2026
- Headquarters
- New York, New York, USAgrafana.com · 28 Sept 2026
Best Grafana Cloud Kubernetes Monitoring alternatives
See all 20 All accessCh 01 Guance Container Monitoring Free planFree trialAndroid Free to start8.1 All accessCh 02 Paessler PRTG Network Monitor Free planFree trialAndroid from $16.67/mo8.0 All accessCh 03 Middleware Free planFree trialAndroid from $0.30/mo7.9 All accessCh 04 Netdata Free planFree trialAndroid from $4.50/mo7.9 All accessCh 05 Dynatrace Kubernetes Monitoring Free trialAndroidAPI from $1.40/mo7.8 All accessCh 06 Checkmk Free planFree trialAPI from $275/mo7.6



Where it ranks on Specifiction
- Best Container Monitoring in 2026#29 of 46
Is Grafana Cloud Kubernetes Monitoring yours?
Claim it for free: prove the domain, then correct facts, plans and screenshots. An editor reviews every change.
Sources
- grafana.com/docs/grafana-cloud/observe-and-act/moni· checked 3 Oct 2026
- grafana.com/docs/grafana-cloud/observe-and-act/moni· checked 3 Oct 2026
- grafana.com/docs/grafana-cloud/observe-and-act/moni· checked 3 Oct 2026
- grafana.com/docs/grafana-cloud/observe-and-act/moni· checked 3 Oct 2026
- grafana.com/docs/grafana-cloud/platform/pricing-and· checked 3 Oct 2026
- grafana.com/security/· checked 3 Oct 2026
- grafana.com/docs/grafana-cloud/observe-and-act/moni· checked 3 Oct 2026
- grafana.com/ai-info/· checked 3 Oct 2026
- grafana.com/solutions/kubernetes-monitoring/· checked 28 Sept 2026
- grafana.com/pricing/· checked 21 Sept 2026